What Should a VO2 and Lactate Response Chart Look Like? A VO2 and lactate response chart presents critical physiological markers to athletes and coaches, indicating the body’s efficiency in utilizing oxygen and producing lactic acid during exercise.
When you engage in physical activity, understanding your VO2 max, or the maximum rate of oxygen consumption, reveals your endurance capacity. Similarly, your lactate threshold—the point at which lactate begins to accumulate in the blood—signals the intensity at which you can maintain exercise without experiencing rapid fatigue.
These indicators hold significance in the design of training programs and the improvement of athletic performance.
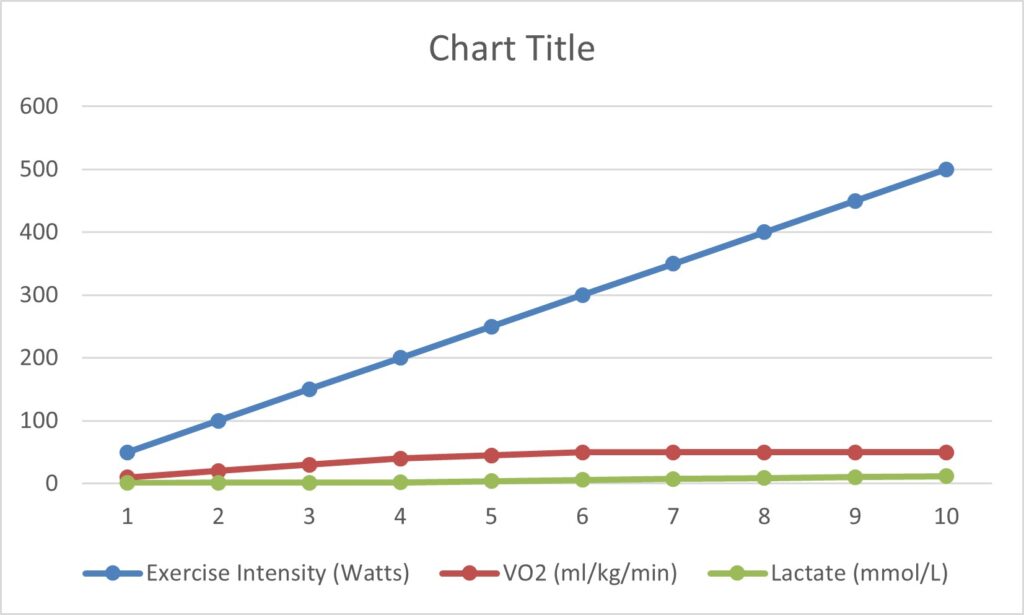
The chart typically plots the relationship between exercise intensity and the body’s responses, making it a visual representation of your cardiovascular and metabolic capabilities.
For a runner, such a chart aids in determining appropriate training zones, which can be leveraged to enhance endurance, speed, and overall race performance.
Precise evaluation and measurement techniques, such as graded exercise tests, are utilized to obtain the necessary data.
By analyzing this information, you can tailor your workouts to improve your VO2 max and lactate threshold, subsequently increasing your efficiency as an athlete.
Key Takeaways: What Should a VO2 and Lactate Response Chart Look Like
- A response chart visualizes your oxygen use and lactate production during exercise.
- It enables the optimization of training for improved endurance and performance.
- Proper testing can tailor workouts to enhance physiological capabilities.
Understanding VO2 and Lactate Testing

VO2 max and lactate threshold are pivotal for assessing your fitness levels and designing an appropriate training program. These measures provide insight into your aerobic endurance and the efficiency of your muscles.
Basic Concepts of VO2 Max
VO2 max, or maximum oxygen uptake, is the highest rate at which your body can consume oxygen during intense exercise. It is expressed in units of milliliters of oxygen used in one minute per kilogram of body weight (ml/kg/min).
VO2 max testing is often conducted in a lab setting where you perform increasingly strenuous exercise while your respiration and oxygen consumption are measured.
Typically, a physiologist will increase the power at regular intervals during a VO2 test. The pinnacle of this test occurs when your oxygen intake no longer rises despite an increase in exercise intensity, indicating your VO2 max has been reached.
The Role of Lactate in Exercise
Lactate, often referred to as lactic acid, is a byproduct of anaerobic metabolism. When your muscles demand more energy than can be provided through oxygen-dependent processes, they switch to producing energy anaerobically, resulting in the accumulation of lactate in your muscles and bloodstream.
Blood lactate levels tend to increase when the intensity of exercise exceeds the capacity of your body’s ability to remove it.
During testing, a blood sample is taken, commonly from a finger or earlobe, to measure lactate levels and understand your body’s response to exercise.
Importance of Lactate Threshold

Your lactate threshold (LT) is the point during exercise at which lactate starts to accumulate in the bloodstream at a faster rate than it can be removed.
Knowing your lactate threshold can help tailor your training to delay the onset of fatigue and improve performance. It’s a critical indicator of endurance capacity.
LT is typically identified via incremental exercise testing, where blood lactate readings are taken at different intensities. This allows you to understand the specific point or intensity at which lactic acid begins to accumulate, signaling the transition to more anaerobic energy production.
Physiological Markers of Performance
In tracking your athletic progress, certain physiological markers provide clear indicators of how your body responds and adapts to different levels of exercise intensity. These markers are critical in designing training programs that improve endurance, efficiency, and overall performance.

Aerobic and Anaerobic Thresholds
Understanding your aerobic threshold allows you to identify the exercise intensity at which your body starts predominantly using oxygen for energy production.
Training at or just below this threshold enhances your body’s ability to utilize oxygen efficiently, resulting in improved endurance over time.
In contrast, your anaerobic threshold represents the point during intense exercise at which your body accumulates lactate faster than it can be cleared, leading to muscle fatigue.
Training just above this threshold can help increase your tolerance to lactate and boost your high-intensity exercise performance.
Endurance and Muscle Efficiency
Your muscles’ efficiency in using energy is a key component of performance.
By developing more mitochondria through endurance training, your muscles become better at producing energy aerobically. This development delays the onset of the anaerobic threshold and reduces fatigue during prolonged or intense efforts.
Efficient energy use helps preserve muscle glycogen and relies more on fat as a fuel source, which is important for long-duration activities.
Stress Response to Exercise Intensity
As you ramp up your exercise intensity, your body’s stress response kicks in, releasing hormones like cortisol and adrenaline.
These hormones increase heart rate, blood pressure, and energy availability, preparing your muscles for the heightened demand.
Your training should include managing this stress response to optimize performance and recovery.
Chronically high stress levels from overtraining can impair performance and lead to overuse injuries. Therefore, it’s essential to balance high-intensity workouts with adequate rest and recovery to allow your body to adapt positively.
Components of a VO2 and Lactate Response Chart
A VO2 and Lactate Response Chart is a visual representation of your body’s efficiency during exercise. It displays vital performance metrics, such as your VO2 max and lactate profile, giving insights into aerobic endurance and metabolic adaptations.
Reading the Lactate Curve
The lactate curve on the graph illustrates the relationship between exercise intensity and blood lactate concentrations. It begins at a low baseline and ascends as the intensity of the workout increases.
You should look for key points, such as the lactate threshold (LT), where there is a significant rise in lactate levels, indicating the point at which your body starts to accumulate lactate faster than it can be removed.
Interpreting VO2 Max Results
Your VO2 max is showcased on the graph as the highest rate of oxygen consumption measured during incremental exercise.
VO2 max results are usually expressed in either milliliters of oxygen per kilogram of body weight per minute (ml/kg/min) or in absolute terms (L/min).
A higher VO2 max indicates a greater capacity of your cardiovascular system to deliver oxygen to the muscles, a crucial adaptation for endurance sports.
Key Indicators on the Graph
When examining a VO2 and Lactate Response Chart, look for:
- Lactate Thresholds: LT1 and LT2 mark the intensities where lactate starts to accumulate more noticeably. These thresholds are pivotal for tailoring training zones.
- Oxygen Uptake: The point at which oxygen consumption plateaus despite increased workload indicates VO2 max.
- Rate of Change: The steepness of the curve can show how quickly lactate accumulates, which reflects your body’s threshold adaptations.
Training Implications and Zones
Incorporating an understanding of VO2 max and lactate thresholds into your training strategy is vital. Doing so allows you to optimize your workouts, promote physiological adaptation, and increase endurance performance.
Applying Thresholds to Training
Your lactate threshold (LT) is a critical indicator of your endurance capacity.
Threshold training involves exercises at intensities near this point to improve your ability to sustain high-intensity efforts for longer.
Designing your workouts to intermittently cross into the lactate threshold zone enhances your body’s ability to clear lactate, a by-product of anaerobic metabolism.
Training Zones:
- Zone 1: Recovery (low intensity)
- Zone 2: Aerobic/endurance (moderate intensity)
- Zone 3: Tempo (comfortably hard)
- Zone 4: Threshold training (hard)
- Zone 5: VO2 max training (very hard)
Adaptation Through Endurance Training
Endurance athletes rely on aerobic conditioning for performance. Prolonged endurance training falls largely within Zone 2. This is where your body improves its ability to utilize oxygen efficiently and burn fat as a fuel source, leading to improved endurance capacity.
Key Adaptations:
- Increased capillarization
- Enhanced mitochondrial efficiency
- Greater aerobic energy production
Tailoring Workouts to Training Zones
Identifying your personal training zones provides a structure for tailoring your workouts.
To improve endurance training, focus your efforts in Zones 1 and 2. For improvements in speed and racing thresholds, integrate sessions in Zones 4 and 5 to challenge your LT and VO2 max.
Balance is crucial; too much time in high zones can lead to fatigue and overtraining, while staying too low may result in minimal performance gains.
Evaluation and Measurement Techniques
To accurately assess your cardiorespiratory fitness and understand how your body responds to exercise, it’s crucial to use reliable evaluation and measurement techniques.
These are based on standardized procedures that give insight into your VO2 max and lactate threshold, correlated with endurance performance.
Graded Exercise Test Procedures
Graded exercise test (GXT) procedures involve incrementally increasing the intensity of the exercise to gauge your body’s maximum capacity for aerobic metabolism.
Typically, testing begins at a low intensity, with gradual increments every few minutes. This measures respiratory gases to determine your VO2 max. This maximal oxygen consumption reflects the efficiency and capacity of your heart, lungs, and muscles during exercise.
- Step 1: Warm-up at a low intensity.
- Step 2: Incremental increase in exercise intensity every 2-3 minutes.
- Step 3: Monitor breathing and heart rate until a steady state is no longer maintained.
Lactate Threshold Tests
The lactate threshold test measures the point during a GXT when your muscles produce lactate faster than it can be cleared, indicating a shift to anaerobic metabolism. This is a critical marker for endurance athletes as it shows how well you can sustain high-intensity exercise.
Blood samples may be taken at each stage of the GXT to determine at which point lactate begins to accumulate in the blood.
- Sampling: Blood is drawn at regular intervals.
- Analysis: Identifying the exercise intensity at which lactate begins to rise significantly.
For more about how lactate measurement and analysis are critical during exercise, especially clinical and athletic performance testing, explore this comprehensive guide for clinicians.
Utilizing a Heart Rate Monitor
Heart rate monitors are practical tools for tracing your heart rate in response to varying exercise intensities. This allows you to work within specific heart rate zones.
By using a heart rate monitor, you can observe the correlation between your perceived exertion and actual heart rate data. This fosters a cooperative relationship between subjective and objective measures of exercise intensity.
- Set-up: Wear the heart rate monitor according to the manufacturer’s instructions.
- Observation: Track your heart rate in real-time during the GXT.
- Analysis: Compare your heart rate with the corresponding exercise intensity.
Reaching your maximum heart rate during the test can provide insights into your cardiovascular fitness level. Understanding the diversity in heart rate responses at lactate threshold points for different athletes is also enlightening, as detailed in this discussion on heart rate zones, VO2 max, and lactate threshold.
Applications for Performance Improvement
When measuring VO2 and lactate response, the charts not only display current fitness levels but also play a crucial role in enhancing athletic performance. Through precise data, you can gauge where you are and what adjustments are necessary for continual improvement.
Monitoring for Overtraining and Fatigue
Recognizing the signs of overtraining and fatigue early is essential for any endurance athlete. By regularly examining your lactate response and VO2 max, you can spot unusual deviations that may signal fatigue.
An increasing lactate production at lower exercise intensities, for instance, might suggest that you’re not recovering adequately between training sessions. This data allows you to promptly adjust your training intensity or volume, safeguarding against the negative impacts of overtraining on your performance.
Exercise Prescription for Athletes
Exercise physiologists and coaches use your VO2 and lactate response charts to tailor exercise prescriptions that match your physiological characteristics.
If you are a runner, this means workouts can be calibrated to improve your specific aerobic threshold or speed at lactate threshold. This bespoke approach boosts your efficiency, performance, and overall improvement in events, while also considering your unique metabolic responses to different levels of intensity.
Setting Goals Based on Lactate Measurements
Setting concrete, achievable goals is made easier with accurate lactate measurements. By determining the intensity at which lactate begins to accumulate rapidly, you can establish precise training zones.
These zones not only help in structuring workouts effectively for performance enhancement but also in giving you tangible targets. For you, as an endurance athlete, your progress can be quantified, tracked, and optimized for continuous improvement.
Case Studies and Practical Examples
When evaluating VO2 and lactate response, understanding the data within the context of real-world scenarios is crucial. Through case studies of marathon runners, cyclists, and swimmers, you’ll see how these metrics mirror specific training effects and physiological responses.
Marathon Runner Analysis
As a marathon runner, your VO2 max is a measure of your body’s maximum oxygen uptake, while your lactate threshold indicates the pace you can maintain before lactic acid rapidly accumulates in your bloodstream.
During marathon training, your VO2 and lactate response chart might reflect the efficacy of long tempo runs and their impact on your endurance. For example:
- VO2 max field test results could show a value of 55 ml/kg/min, signifying strong aerobic capacity.
- Successive tests might demonstrate improvement, alongside a noticeable shift in your lactate threshold, which could mean that your running speed at lactate threshold increased from 7.0 to 7.5 mph.
Cycling Performance Metrics
Cyclists rely on precise performance metrics to fine-tune their training. A cyclist’s chart typically captures data such as training zone intensities and corresponding lactate response.
Imagine a cyclist performing a graded exercise test on a bike ergometer, resulting in:
- A lactate curve that flattens as their endurance capacity improves, signaling the ability to cycle at a higher intensity with lower lactate accumulation.
- As their breathing becomes more efficient, their chart will often exhibit a decreased ventilatory response at the same relative intensity levels.
Field tests for cyclists might involve a 20-minute all-out effort, with lactate measured at intervals to assess the effectiveness of interval training.
Adapting Training for Swimmers
Swimmers must constantly adapt their training to improve performance. Your VO2 and lactate measurements will be key indicators of your physiological adaptations.
Monitoring changes after implementing different workouts will direct how you adjust your training intensity. For instance:
- Including more anaerobic sets could initially raise your lactate levels on your response chart, later leading to a higher lactate threshold.
- By controlling your effort through designed sets for half marathons of swimming (if such a term were applicable), you could track and aim to increase your velocity at VO2 max over time.
Each discipline – running, cycling, swimming – possesses unique physiological factors that shape the VO2 and lactate response charts. These tools are vital in guiding your training regimen to enhance your overall endurance and performance.
Frequently Asked Questions
In this section, you’ll find specific information on how lactate threshold and VO2 max are interconnected, what you can learn from lactate response charts, and the implications for your training strategies.
How is lactate threshold testing performed in relation to VO2 max?
Lactate threshold testing is usually part of an incremental exercise test that gradually increases in intensity. During the test, blood lactate measurements are taken to determine the point at which lactate begins to accumulate rapidly in the bloodstream.
This point is compared to VO2 max data to understand the relationship between oxygen consumption and lactate production.
What does a typical lactate curve indicate during incremental exercise?
A typical lactate curve shows a relatively flat line at low intensities, indicating stable lactate levels. As intensity increases, the curve ascends sharply, reflecting a significant rise in blood lactate concentrations. This point of inflection is the lactate threshold, signifying a shift from aerobic to anaerobic metabolism.
How does VO2 max correlate with lactate production during strenuous activities?
During strenuous activities, your VO2 max is the maximum rate at which you can process oxygen. Lactate production increases when the demand for energy outpaces the oxygen available for aerobic metabolism.
A higher VO2 max generally means a higher lactate threshold, as your body can sustain aerobic metabolism at higher intensities.
What constitutes a normal lactate response during cardiovascular workouts?
A normal lactate response during cardiovascular exercises starts with low lactate levels at the onset of activity. As intensity builds, lactate remains relatively balanced until you reach a lactate threshold. Beyond this point, lactate levels rise quickly, which needs to be considered when determining the intensity of your workouts.
In what ways can one accurately interpret results from a lactate threshold test?
To accurately interpret results from a lactate threshold test, examine the intensity at which there is a notable increase in blood lactate levels.
This requires identifying two critical inflection points: the first lactate turnpoint (LT1) and the second lactate turnpoint (LT2). Understanding these points allows you to tailor training zones to your physiology.
What are the implications of lactate threshold on endurance training strategies?
The implications of your lactate threshold on endurance training strategies are significant.
Knowing your lactate threshold allows you to adjust training intensity for improving stamina and performance.
Endurance training can then be specifically designed to increase the lactate threshold. This allows you to perform at higher intensities for longer periods.